[1]:
from pystencils.session import *
import timeit
%load_ext Cython
Demo: Benchmark numpy, Cython, pystencils
In this notebook we compare and benchmark different ways of implementing a simple stencil kernel in Python. Our simple example computes the average of the four neighbors in 2D and stores it in a second array. To prevent out-of-bounds accesses, we skip the cells at the border and compute values only in the range [1:-1, 1:-1]
Implementations
The first implementation is a pure Python implementation:
[2]:
def avg_pure_python(src, dst):
    for x in range(1, src.shape[0] - 1):
        for y in range(1, src.shape[1] - 1):
            dst[x, y] = (src[x + 1, y] + src[x - 1, y] +
                         src[x, y + 1] + src[x, y - 1]) / 4
Obviously, this will be a rather slow version, since the loops are written directly in Python.
Next, we use numpy functions to delegate the looping to numpy. The first version uses the roll function to shift the array by one element in each direction. This version has to allocate a new array for each accessed neighbor.
[3]:
def avg_numpy_roll(src, dst):
    neighbors = [np.roll(src, axis=a, shift=s) for a in (0, 1) for s in (-1, 1)]
    np.divide(sum(neighbors), 4, out=dst)
Using views, we can get rid of the additional copies:
[4]:
def avg_numpy_slice(src, dst):
    dst[1:-1, 1:-1] = src[2:, 1:-1] + src[:-2, 1:-1] + \
                      src[1:-1, 2:] + src[1:-1, :-2]
To further optimize the kernel we switch to Cython, to get a compiled C version.
[5]:
%%cython
import cython

@cython.boundscheck(False)
@cython.wraparound(False)
def avg_cython(object[double, ndim=2] src, object[double, ndim=2] dst):
    cdef int xs, ys, x, y
    xs, ys = src.shape
    for x in range(1, xs - 1):
        for y in range(1, ys - 1):
            dst[x, y] = (src[x + 1, y] + src[x - 1, y] +
                         src[x, y + 1] + src[x, y - 1]) / 4
If available, we also try the numba just-in-time compiler
[6]:
try:
    from numba import jit

    @jit(nopython=True)
    def avg_numba(src, dst):
        dst[1:-1, 1:-1] = src[2:, 1:-1] + src[:-2, 1:-1] + \
                          src[1:-1, 2:] + src[1:-1, :-2]
except ImportError:
    pass
And finally we also create a pystencils version of the same stencil code:
[7]:
src, dst = ps.fields("src, dst: [2D]")

update = ps.Assignment(dst[0,0],
                       (src[1, 0] + src[-1, 0] + src[0, 1] + src[0, -1]) / 4)
avg_pystencils = ps.create_kernel(update).compile()
[8]:
all_implementations = {
    'pure Python': avg_pure_python,
    'numpy roll': avg_numpy_roll,
    'numpy slice': avg_numpy_slice,
    'pystencils': avg_pystencils,
}
if 'avg_cython' in globals():
    all_implementations['Cython'] = avg_cython
if 'avg_numba' in globals():
    all_implementations['numba'] = avg_numba
Benchmark functions
We implement a short function to get in- and output arrays of a given shape and to measure the runtime.
[9]:
def get_arrays(shape):
    in_arr = np.random.rand(*shape)
    out_arr = np.empty_like(in_arr)
    return in_arr, out_arr

def do_benchmark(func, shape):
    in_arr, out_arr = get_arrays(shape)
    func(src=in_arr, dst=out_arr) # warmup
    timer = timeit.Timer('f(src=src, dst=dst)', globals={'f': func, 'src': in_arr, 'dst': out_arr})
    calls, time_taken = timer.autorange()
    return time_taken / calls
Comparison
[10]:
plot_order = ['pystencils', 'Cython', 'numba', 'numpy slice', 'numpy roll', 'pure Python']
plot_order = [p for p in plot_order if p in all_implementations]

def bar_plot(*shape):
    names = plot_order
    runtimes = tuple(do_benchmark(all_implementations[name], shape) for name in names)
    speedups = tuple(runtime / min(runtimes) for runtime in runtimes)
    y_pos = np.arange(len(names))
    labels = tuple(f"{name} ({round(speedup, 1)} x)" for name, speedup in zip(names, speedups))

    plt.text(0.5, 0.5, f"Size {shape}", horizontalalignment='center', fontsize=16,
             verticalalignment='center', transform=plt.gca().transAxes)
    plt.barh(y_pos, runtimes, log=True)

    plt.yticks(y_pos, labels);
    plt.xlabel('Runtime of single iteration')

plt.figure(figsize=(8, 8))

plt.subplot(3, 1, 1)
bar_plot(32, 32)

plt.subplot(3, 1, 2)
bar_plot(128, 128)

plt.subplot(3, 1, 3)
bar_plot(2048, 2048)
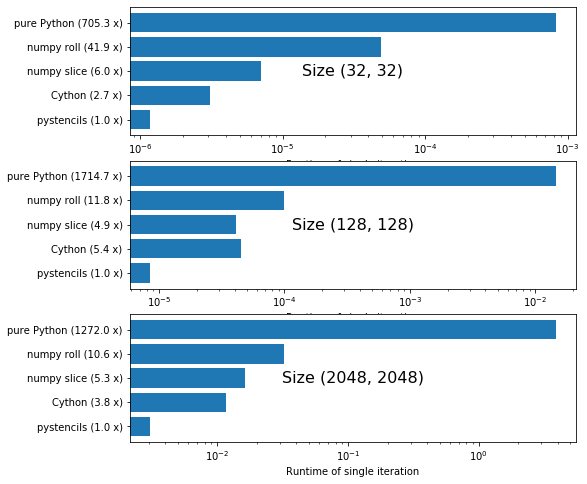
All runtimes are plotted logarithmically. Numbers next to the labels show how much slower the version is than the fastest one.