Demo: Stencils
A stencil is a class which holds internally a tuple of directions, where each direction is again a tuple with as many entries as there are dimensions. The stencil class behaves like a nested tuple. Internally it already has a predefined set of commonly used stencils. A common notation for stencils in the lattice Boltzmann literature is the DxQy notation, where x is the dimension of the space, and y the number of directions. For example D2Q9 is a two-dimensional stencil with 9 directions. The available DxQy stencils can be obtained via the Stencil enum which is in the enum submodule of lbmpy:
[2]:
stencil = LBStencil(Stencil.D2Q9)
stencil
[2]:
| Nr. | Direction Name | Direction |
|---|---|---|
| $0$ | $\mathtt{\text{C}}$ | $\left( 0, \ 0\right)$ |
| $1$ | $\mathtt{\text{N}}$ | $\left( 0, \ 1\right)$ |
| $2$ | $\mathtt{\text{S}}$ | $\left( 0, \ -1\right)$ |
| $3$ | $\mathtt{\text{W}}$ | $\left( -1, \ 0\right)$ |
| $4$ | $\mathtt{\text{E}}$ | $\left( 1, \ 0\right)$ |
| $5$ | $\mathtt{\text{NW}}$ | $\left( -1, \ 1\right)$ |
| $6$ | $\mathtt{\text{NE}}$ | $\left( 1, \ 1\right)$ |
| $7$ | $\mathtt{\text{SW}}$ | $\left( -1, \ -1\right)$ |
| $8$ | $\mathtt{\text{SE}}$ | $\left( 1, \ -1\right)$ |
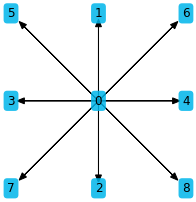
[3]:
plt.figure(figsize=(3, 3))
stencil.plot()
In the literature there is no agreement or convention of the direction ordering. Thus the LBStencil class takes an optional parameter defining the ordering.
[4]:
stencil = LBStencil(Stencil.D2Q9, ordering='counterclockwise')
plt.figure(figsize=(3, 3))
stencil.plot()
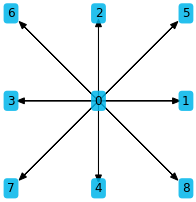
Compare this to the visualization above and note that only the direction order has changed. The LBM method is independent of the stencil ordering, as long as one order is consistently used everywhere.
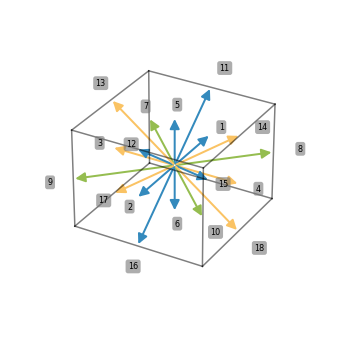
The visualization routines take an optional data parameter, which has to be a sequence of information to attach to each direction. This info is then shown as labels instead of the direction index.
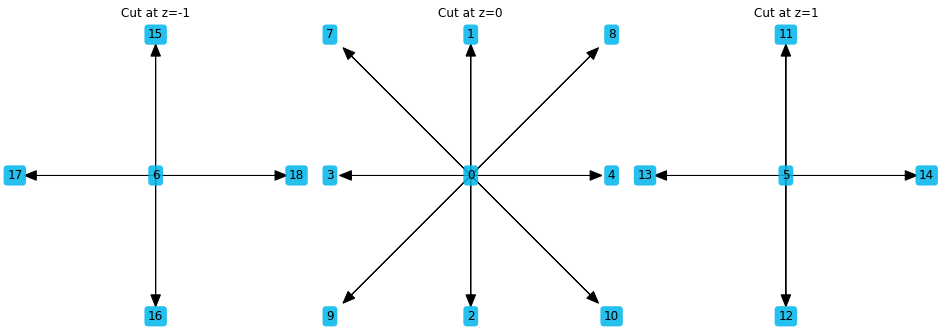
There are two ways to visualize 3D stencils - either as a 3D plot, or as three 2D plots:
[5]:
LBStencil(Stencil.D3Q19).plot(data=list(range(19)))
[6]:
LBStencil(Stencil.D3Q19).plot(slice=True, sliceAxis=2)